Git, Monitor and Web Panels
Git, Monitor, and Web panels are layout leaves, the same as a terminal pane: you split them into a tab, resize them, and drag them around like any other pane. This page covers what each one shows and how you add it. For the mechanics of splitting, resizing, and rearranging panes, see Tabs, Panes and Windows.
Adding a panel
You can open the add-pane menu from any of these:
- The
+button in a pane's title bar. - The
+button in the tab bar. - Right-click a pane and choose Add pane.
This menu lists the built-in pane kinds — Terminal, Web, Git, Monitor, and File — plus any custom entries configured for your setup. Terminal and File panes are covered in Files and Transfers; this page covers Web, Git, and Monitor.
A pane you add this way splits to the right of the pane you clicked from by default. Hold
⌥ while clicking an entry to split it downward instead.
The File menu has a separate Panes submenu with direct entries for the same kinds, each with its own keyboard shortcut where one exists:
| Pane | Shortcut |
|---|---|
| New web pane | ⌘⇧B |
| New Git pane… | none |
| New monitor pane | ⌘⇧E |
A new Web pane opens immediately at your default URL — it does not ask you anything first, since the address bar is right there for you to change it. A new Git pane asks for a repository path before it opens. A new Monitor pane inherits the connection of the pane you split from: split it off a terminal connected to a remote host and it monitors that host; split it off a local terminal (or add one with nothing focused) and it monitors this Mac.
Git panel
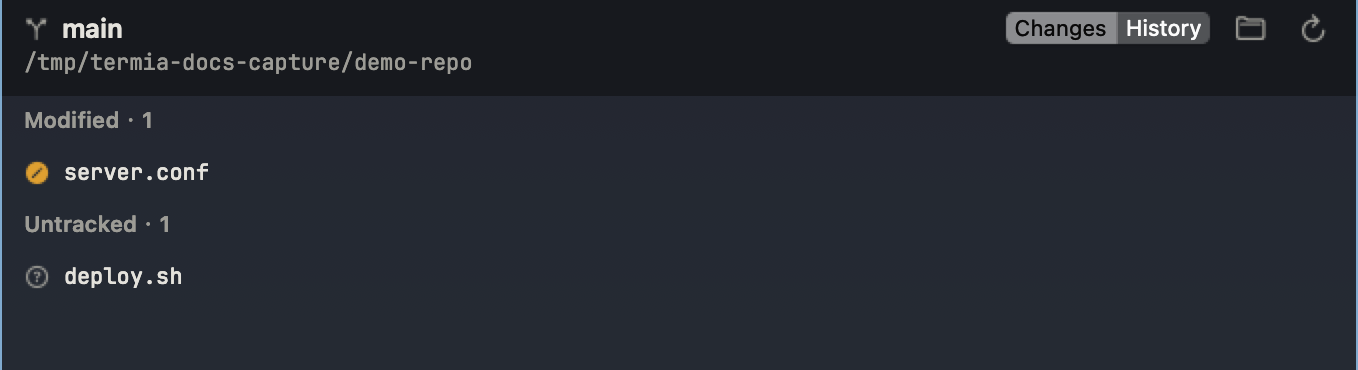
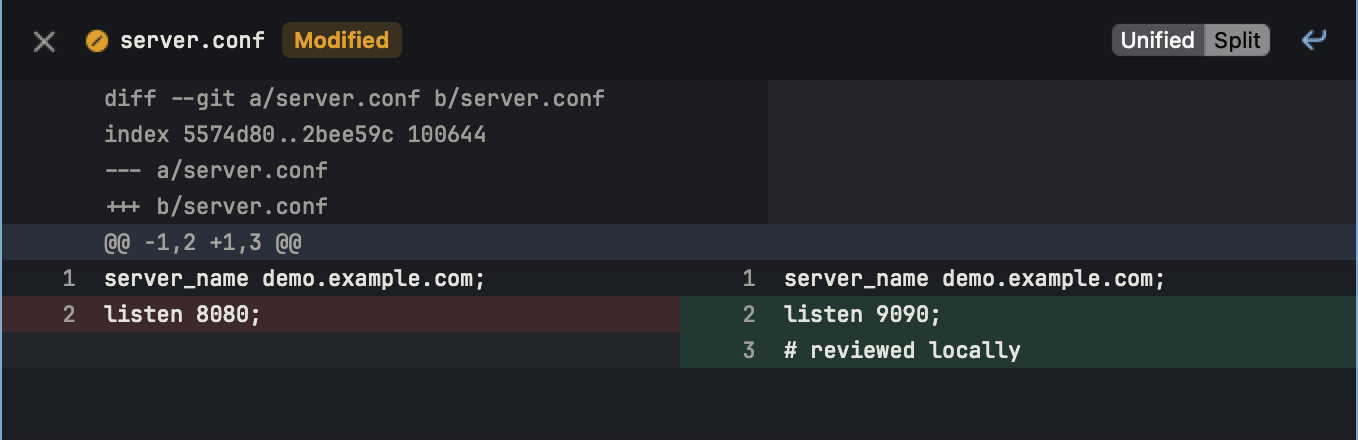
The Git panel shows a repository on this Mac and lets you stage, commit and browse its history. It invokes local Git; a remote terminal next to the panel does not redirect Git to that server. Review remote Agent changes with Git in the remote shell or another remote development tool.
Header
- The current branch name (or a dash if it can't be read yet).
- Ahead/behind counts against the upstream branch, shown as
↑N/↓N, plus the tracking branch name if one is set. - The repository path, truncated from the front; hover it for the full path.
- A Changes / History switch.
- A folder icon to change which repository the panel points at.
- A refresh icon that re-reads the status (and, on the History tab, reloads the commit log).
Changes
Files are grouped into Staged, Modified, Untracked, and Deleted, each with a count in its header. Group headers aren't selectable — only file rows are.
- Click a file (or select it and press
Return) to open its diff. - Right-click a file for View diff, and either Unstage (for a staged file) or Stage and Discard changes (for an unstaged one). Discarding asks you to confirm first and warns that it can't be undone.
- Staging, unstaging, and discarding all report failures in an alert dialog with the underlying error — a locked index or a permissions problem doesn't just silently do nothing.
Below the list, a commit-message field and a Commit button commit whatever is currently staged. On success the field clears and the status refreshes; on failure you get an alert with the error.
Diff viewer
Opening a diff covers the whole panel; close it with the × in its header to get back to
the list. Its header also shows:
- A status badge (Added, Modified, Deleted, Renamed, Copied). For a rename it shows
old path → new path. - A Unified / Split mode switch. Unified shows one column with both old and new line numbers; Split shows old and new side by side.
- A wrap-long-lines toggle.
Your last choice of mode and line wrap is remembered the next time you open any diff, not just this one. Added and removed lines get a tinted background, and recognized source files (Swift, Go, C-family languages, JavaScript/TypeScript, Python, Ruby, Rust, shell, JSON, YAML, CSS, SQL) get basic keyword and string highlighting.
Very large diffs load 2,000 lines at a time, with a progress bar reading "Loaded X / Y lines" and a button to cancel loading. Cancel pauses it — the bar switches to "Paused — showing first X / Y lines" with a Continue loading button. A binary file shows "Binary file — no text diff"; a file with no differences shows "No changes"; a failed load shows "Failed to load diff".
History
The History tab lists commits 50 at a time, with a Load more button once a full page has loaded. Click a commit to see its changed files — each with a status icon and, for renames, the old and new path — under a "N files changed" line; a back arrow returns you to the log. Click a file in that list to view the diff for that file in that commit.
Which repository it uses
A new Git pane asks you to type or paste a repository path (there's no folder-browse button in that first dialog; the field starts pre-filled with a default value you'll usually want to replace). Once the panel is open, use the folder icon in its header to:
- Choose Repository…, which opens a folder picker.
- Pick from Recent — up to 8 repositories you've opened before, remembered on this Mac across restarts and listed most-recent-first (the current repository is left out).
Switching repositories updates the header, resets the History tab, and is saved with the pane so it reopens to the same repository the next time you launch Termia.
Empty, loading, and error states
- While the first status read is in flight, the panel shows a loading placeholder instead of a blank list.
- A repository with no changes shows "Working tree clean"; one with no commits yet shows "No commits yet" on the History tab.
- A directory with no
.gitat all shows "Not a git repository", with a hint and a Choose Repository… button — the only useful next step from there is pointing the panel elsewhere. - A directory that does have
.gitbut where the status read itself failed shows a different message — "Could not read repository status" — with the underlying error and a Retry button. These two cases are kept apart deliberately: an empty repository isn't a fault, but a failed read is.
Monitor panel
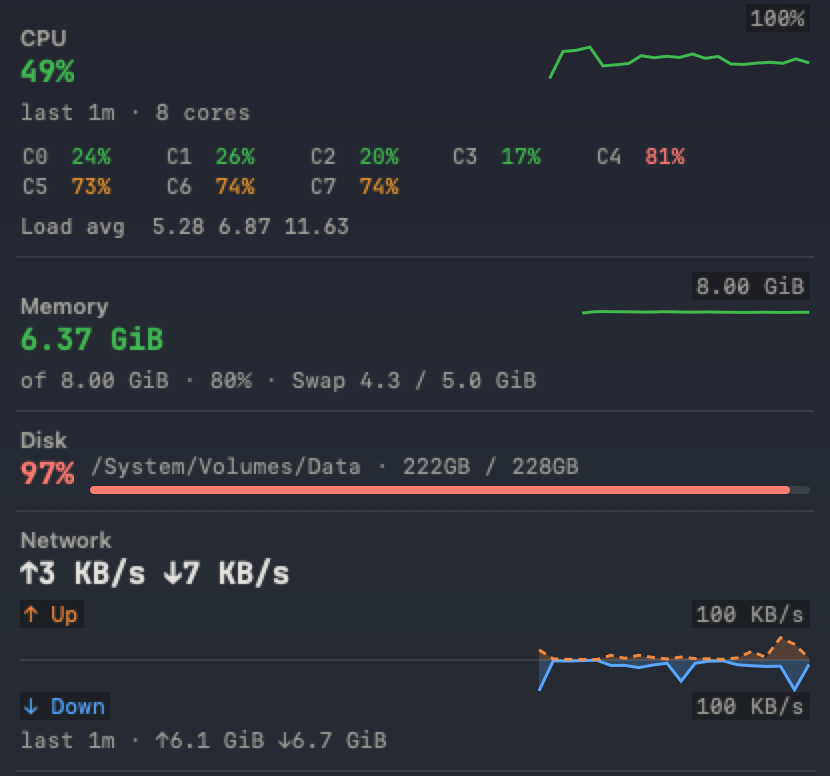
The Monitor panel charts CPU, memory, disk, and network usage for the machine behind the connection it's watching — this Mac or a remote host over SSH, whichever the pane is attached to.
Full form
- Header: the host name (or "This Mac" for a local connection), platform and version, and uptime.
- CPU card: a rolling usage chart plus a grid with one tile per core, each showing its live percentage (hover any tile for "Core N" and its exact value).
- Memory card: a rolling usage chart, plus a swap meter when the host reports swap in use.
- Disk card: one small card per partition, each with a usage ring, its mount point, and used/total capacity; hover a card for its free space.
- Network card: a chart of upload and download rate (upload is dashed, download is solid, so the two are distinguishable without relying on color alone), plus lifetime totals for each direction.
- Processes card: a table of the busiest processes. Its columns and row count adapt to how much room the pane has — a narrow pane shows just name and CPU%; a wider one adds PID and memory; the widest adds executable path and thread count.
Choose 1m, 5m, 30m or 12h in the full monitor to inspect recent trends. Longer spans use 10-second or 60-second buckets; curves show averages and a peak layer preserves spikes. Aggregate history is persisted by the local backend in sysinfohist.json.gz, normally once a minute and on shutdown. No samples are collected while the app is closed or the connection is unavailable; gaps are missing data, not zero usage. This is a desktop diagnostic monitor, not an always-running alerting service.
Remote hosts
A Monitor pane attached to a remote connection shows a "Not connected to <host>" overlay
with a Reconnect button whenever that connection is down; monitoring resumes on its
own once the connection is back. If the connection stays up but no data arrives for a
while, the panel shows "No monitoring data" with its own Retry.
You can point an existing Monitor pane at a different connection without recreating it, from the File menu's Switch connection… item. This changes only that pane — unlike a terminal, a Monitor pane doesn't drag the rest of its pane group along with it. Clearing history and re-subscribing happens automatically when you do this, so you never see a mix of the old and new host's numbers.
Compact form: the complete vertical and horizontal strips
Make the monitor narrower than about 125 points for a vertical rail, or shorter than about 120 points for a horizontal strip. These are the same live monitor adapting to the pane size. The figures below retain the complete strip, including the settings button and both ends.

The vertical rail keeps resource indicators and the current process summaries together. Hover to inspect exact values; scroll or drag the contents when they exceed the available height.

The horizontal strip fits whole indicators into its available width. Widen it to show more process summaries; increase its height to restore the full overview. The right-end gear opens settings and serves as the pane drag handle.
Minimize to the terminal bottom edge
Click Minimize to terminal in the full monitor header. A terminal connected to the same host must be present in the tab. Live sampling continues in the bottom strip; with enough width, CPU, memory, disk and network stay visible together.

Hover a segment for its detail card. Click the restore control or double-click the strip to return to the saved pane side and width. Drag it to another terminal on the same host, or to a pane edge to reopen there.
Web panel
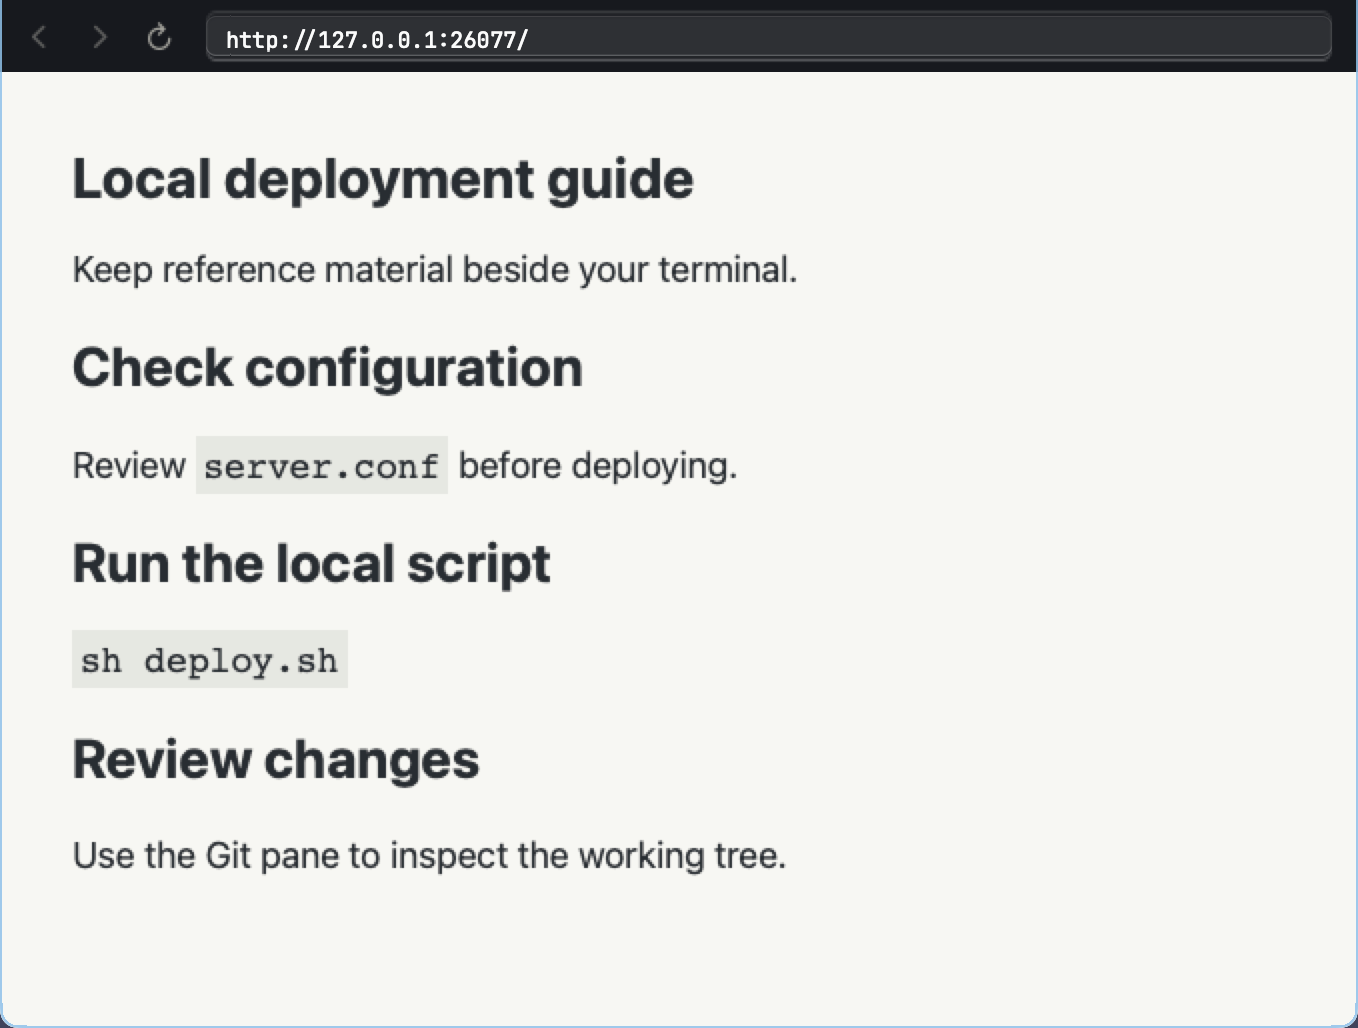
The Web panel is a small in-app browser: an address bar with back, forward, and reload controls above an embedded page.
- Type a URL and press
Returnto load it. Text without a URL shape (no scheme, no dot) is treated as a search query instead. - The default URL for a newly added Web pane, and the search engine used for plain-text queries, are both configurable in Settings, under the Web page.
- Links that open in a new tab or window on a normal web page open inside the same panel instead — there's no second panel to put them in, and this keeps things like a login redirect reachable with the back button.
- JavaScript alerts, confirmations, text prompts, and file-picker inputs on the page are all supported.
- The current page's URL is saved with the pane, so it reopens to the same page next time.
A page that fails to load shows an error placeholder instead of a blank page, with a reason (server not found, connection refused, a certificate problem, no network, or a timeout) and a Retry button.