Monitoring
Keep resource usage beside the command you are running. The Electron monitor combines a full overview, automatic horizontal and vertical compact layouts, and a live strip at the bottom of a terminal. You can keep checking the host while giving your terminal more room.
Open the full overview
Click the terminal's Show monitor pane control, or choose Monitor from Add Pane (+). Check the connection: monitoring belongs to that pane's local or remote host. If an existing pane only shows one chart, right-click the monitor and choose Plot Type → All.
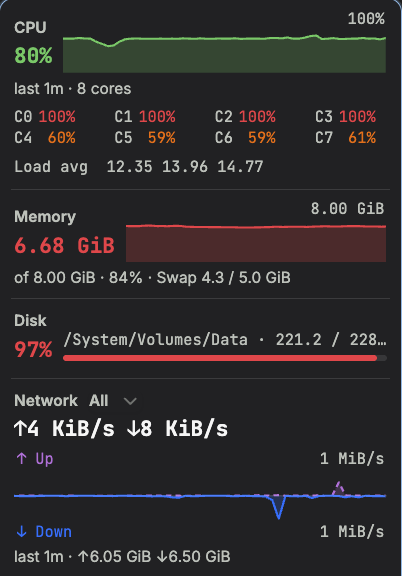
The overview brings these readings together:
- CPU: total usage, per-core readings, load averages and a trend.
- Memory: current use, capacity, percentage and swap, with a trend.
- Disk: the most occupied volume, its usage bar and available volume details.
- Network: upload/download rates and a mirrored trend; choose an interface when available.
- Host and processes: host facts above the resource sections and a sortable process table below. Scroll to inspect them; the documentation crops focus on resource usage.
Usage colors help you spot pressure quickly. CPU and memory pair a large current value with a small trend; network upload and download use separate directions, with a dashed upload line. These readings come from the actual host.
Minimal layouts: vertical and horizontal
Drag a pane divider to change how much space the monitor takes. It adapts automatically; you do not need to create a different kind of monitor.
| Layout | How to reach it | When to use it |
|---|---|---|
| Full overview | Give the pane enough width and height | Read values, trends and detailed sections together |
| Vertical icon rail | Make the pane narrow | Keep a compact resource overview beside a wide terminal |
| Horizontal icon strip | Put the monitor above/below a terminal and reduce its height | Keep resource indicators visible without a tall monitor |
| Terminal bottom strip | Click Minimize to terminal in the overview's host row | Give the pane space back to the terminal while readings stay live |
Vertical rail

This screenshot retains the entire vertical rail, including its settings button and all current indicators. The narrow rail retains resource icons and small CPU/memory trends, with network rates and available disk/process indicators. Hover over an indicator for more detail. Widen it again to return to the full overview. Available readings depend on the host, and the rail scrolls when they exceed its height.
Horizontal strip

The same monitor becomes a horizontal strip when its height is reduced. Resource indicators run across the pane; hover details provide room for closer inspection. It fits whole indicators into the available width, so a wider strip can show more. Increase its height to return to the full overview.
Minimize to the terminal bottom edge
Restore enough room to show the overview's host row, then click Minimize to terminal. A terminal connected to the same host in the current tab is required. The monitor pane closes and a compact live summary appears on that terminal's bottom edge.

The bottom strip prioritizes readings according to its width. With enough room it includes CPU, memory, disk and upload/download rates; smaller terminals show fewer items. It keeps collecting while minimized. Hover over an item to inspect its current detail card.
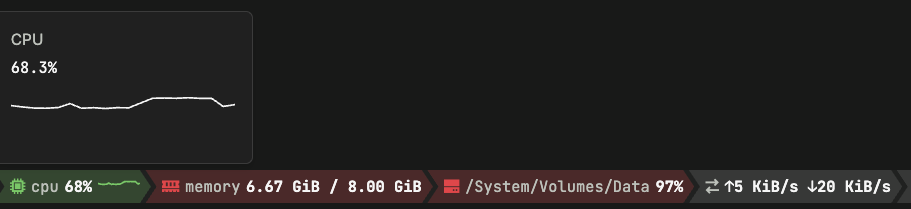
Click the restore control at the right end, or double-click the strip, to reopen a full All overview. The saved side and width are reused. You can also drag the strip onto another terminal connected to the same host, or onto a pane edge to reopen it there; the drop zones show the available targets.
Live samples and longer history
Use 1m / 5m / 30m / 12h in the full overview's host row. The one-minute view uses live samples; longer spans aggregate samples while retaining averages and peaks, so a short spike is not flattened into a quiet average. Each host keeps its selected span.
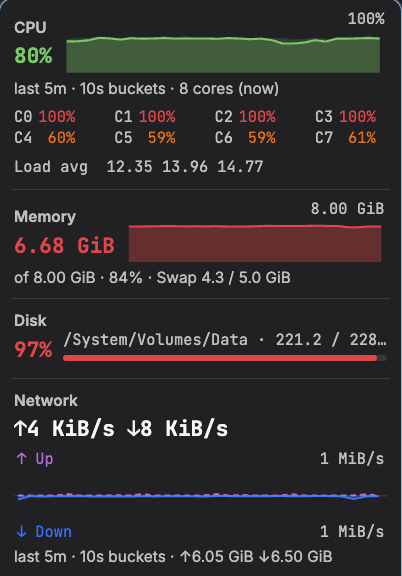
History is saved locally every minute and on orderly shutdown. Reopening a pane can show already collected history. There are no new samples while Termia is closed, the connection is down, or no collector is subscribed. Remote monitoring requires wsh on the host; see Connections and wsh.
Graphite and Neon
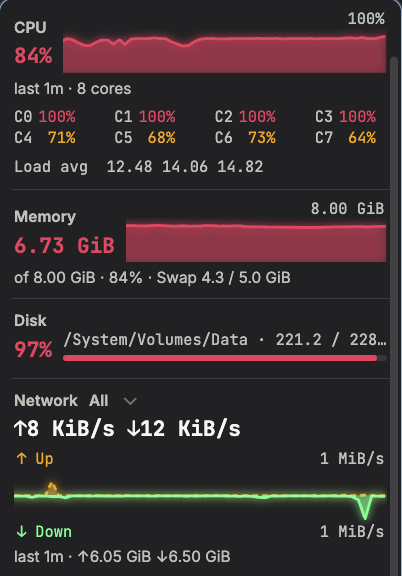
Right-click the monitor and choose Monitor Skin → Graphite or Neon. Graphite uses the restrained default palette; Neon uses brighter colors and glowing trends. The skin is shared by monitor panels and the minimized strip.
Connection and collection status
Check the pane connection before comparing hosts. A disconnected monitor shows its connection state; reconnect from the pane controls. If the host is connected but collection fails, the monitor offers Retry. Missing data and gaps are not evidence of zero usage. Termia does not provide background monitoring alerts or a team incident-management service.
See Layout for pane placement and Widgets for the other views.