Telemetry
Summary
Telemetry is off by default in this app. There is no first-run consent screen or settings
toggle for it in the current UI — turning it on or off is a configuration change you make
yourself, either by editing a file or by running a wsh command. If you never touch the
telemetry:enabled setting, nothing described below is ever sent.
If you do turn it on, what gets collected is anonymous usage counters (things like "a tab was created" or "the app was open for N minutes") attached to a randomly generated id — never your commands, file contents, terminal output, or AI prompts.
How to check or change it
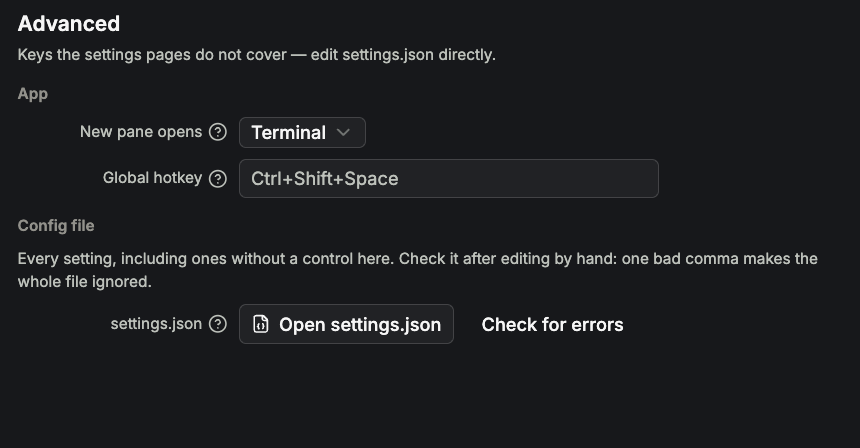
The setting lives in your settings.json (in the app's config directory, alongside your
other settings) as a single key:
{
    "telemetry:enabled": false
}
You can also change it from a terminal block with wsh, without opening the file yourself:
wsh setconfig telemetry:enabled=true
To check the current value, open the file itself — wsh editconfig opens settings.json in
a preview block for you.
There is currently no button or switch for this in the app's settings window — the only way to change it is one of the two methods above.
What is collected when it's enabled
All telemetry is attached to a client id: a random UUID generated once, the first time the app runs, and stored in your local database. It does not contain any information about you or your machine, and a fresh id is generated if you clear your local app data.
The app records small, structured events for things like:
- App lifecycle — the app starting up, shutting down, and roughly how many minutes it was open, in the foreground, or actively used (based on your keyboard/mouse activity).
- App/system basics — app version, build time, OS and CPU architecture, whether it's a development build, and whether auto-update is on and which update channel is selected.
- Display info — the resolution, pixel density, and count of your monitors. No monitor names or arrangement beyond that.
- Counts — periodic snapshots of how many tabs, blocks, windows, and workspaces you have open, how many SSH/WSL connections you've used, and how many custom widgets, custom AI presets, or customized settings you have defined (as counts only, never their contents).
- Feature use — specific actions like magnifying a block, changing a tab's theme,
creating a tab or block (the block's type, e.g.
termorpreview, but nothing about what's in it), and running awshcommand (which subcommand, and whether it errored — not its arguments). - Connection attempts — that an SSH or WSL connection succeeded or failed, and which kind it was. The hostname, IP address, or any other identifying detail of the connection is never included.
- Crash/panic reports — that a backend crash happened and an internal string identifying where in the code it occurred. No stack trace and no data from the session is sent.
None of this includes keystrokes, terminal output, file contents, command text or arguments, or connection addresses.
Event reference
Every event is one row: a name, a timestamp, and a small set of properties. These are the event names this build defines:
| Event | When it fires | What it carries |
|---|---|---|
app:startup | Every app launch | version, build time, OS/architecture, dev-build flag, auto-update channel/enabled, whether this is the very first launch ever |
app:shutdown | Every clean shutdown | nothing extra |
app:activity | Roughly every minute the app runs, merged into hourly buckets | minutes active / in the foreground / open |
app:display | Once, a few seconds after startup | monitor count, resolution, and pixel density of each connected display |
app:counts | About once an hour, only if something changed since last time | number of tabs/blocks/windows/workspaces, SSH/WSL connections used, and counts (not contents) of custom widgets, custom AI presets, and customized settings |
action:createtab | A new tab is created | — |
action:createblock | A new block is created | the block's view type, e.g. term, preview, sysinfo |
action:magnify | A block is magnified | the block's view type |
action:settabtheme | A tab's theme is changed | — |
wsh:run | A wsh subcommand is run | which subcommand, and whether it returned an error |
conn:connect / conn:connecterror | An SSH or WSL connection attempt succeeds or fails | connection kind (ssh or wsl) only |
debug:panic | The Go backend crashes | an internal string identifying where in the code, nothing about your session |
Local recording happens independent of the setting
The counters above are written to a local, un-uploaded table in your local database as soon
as the corresponding action happens — this is true even while telemetry:enabled is false.
Only the network upload described in When data is sent is gated by the setting; nothing
reads or displays this local queue inside the app, and it exists only so a send has data ready
the moment you turn telemetry on. Entries older than 28 days are dropped automatically,
whether or not telemetry is enabled.
AI usage is not currently reported
The telemetry schema still has a slot for recording which AI backend a request used (no
prompt text, just a label like "which backend"). In this build that code path belongs to a
legacy in-app AI chat feature that no longer exists — nothing in the current UI or the wsh
CLI can trigger it, so in practice this event is never produced. AI work in this app happens
through the Termia Agent running inside a terminal block, which is a separate process this
telemetry system does not instrument.
When data is sent
If telemetry is enabled, data is sent:
- About 10 seconds after the app starts.
- Every 4 hours after that, for as long as the app stays open.
- Once more when the app is closed, so the final stretch of a session isn't lost.
Toggling the setting itself also sends a one-time signal recording that your client id turned telemetry on or off — separate from the regular data upload above.
Data is grouped by day. If you turn telemetry off and later back on, only new data going forward is collected; nothing from while it was off gets backfilled.
What is never collected
Regardless of the setting, this app does not collect:
- Terminal input, output, or scrollback content
- File contents you open, edit, or preview
- AI prompts, responses, or conversation content
- Command-line arguments (only that a
wshsubcommand ran, and whether it failed) - Hostnames, IP addresses, or other identifying details of your connections
- Anything that identifies you personally (name, email, account)
No first-run consent screen
Earlier versions of the underlying project showed a welcome screen with a telemetry
opt-in/opt-out choice on first launch. That screen does not exist in this app — startup
proceeds straight to your workspace, and telemetry stays at whatever telemetry:enabled is
set to (off, unless you've changed it). Check settings.json (wsh editconfig) at any time
to confirm the current value.